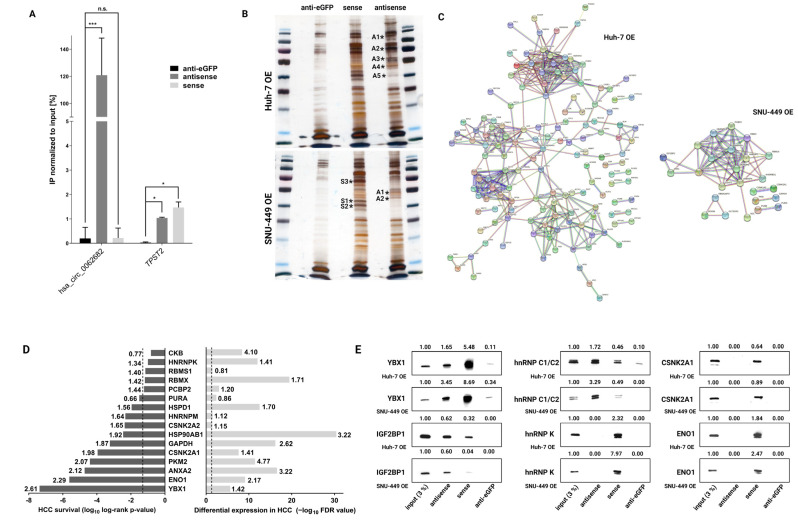
Figure 6.
Biotinylated oligonucleotide pulldown of hsa_circ_0062682 coupled with mass spectrometry identifies its potential protein binding partners. (A) Confirmation of a specific pulldown by RT-qPCR (n = 3) in Huh-7 OE cell line; (B) silver staining of biotinylated oligonucleotide pulldowns in Huh-7 OE (top) and SNU-449 OE (bottom) cell lines (* indicates excised bands for mass spectrometry analysis; letters and numbers indicate excised bands indicated in Table S9); (C) functional protein network analysis in STRING database of identified proteins by mass spectrometry (minimum 2 unique peptides present); (D) alignment of top identified proteins by mass spectrometry with differential expression in HCC (right: numbers indicate fold change ratio between the tumour and normal samples) and with overall survival of HCC patients (left: numbers indicate hazard ratio); dotted line indicates p-value ≤ 0.05; (E) Western blotting of potential protein binding partners in biotinylated oligonucleotide pulldowns of both stable overexpressing cell lines; numbers indicate densitometric analysis of presented bands normalized to the input. OE: overexpression. Results are represented as averages and error bars represent standard deviation. The uncropped blots are shown in Supplementary Data.

