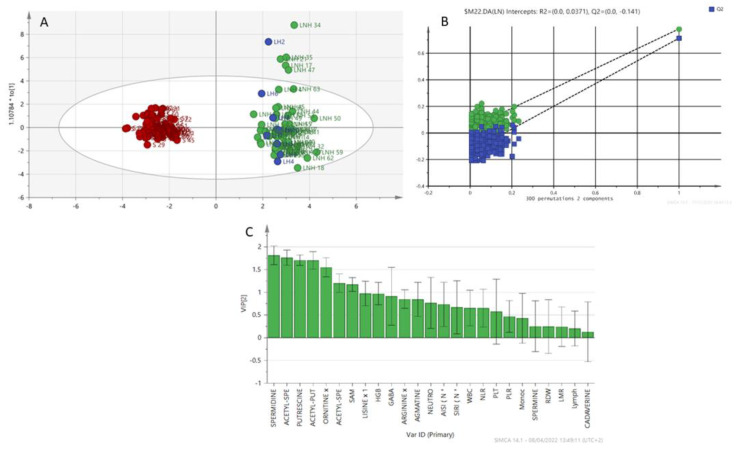
Figure 4.
(A) OPLS-DA, NHL patients (green), LH patients (blue) and healthy patients (red). (B) Variable importance in projection (VIP) plot: important features identified by OPLS-DA in descending order of importance. The graph represents the relative contribution of parameters to the variance between individuals. High value of VIP score indicates great contribution to the group separation (LNH+LH vs. healthy). (C) Permutation (LNH+LH vs. healthy).

