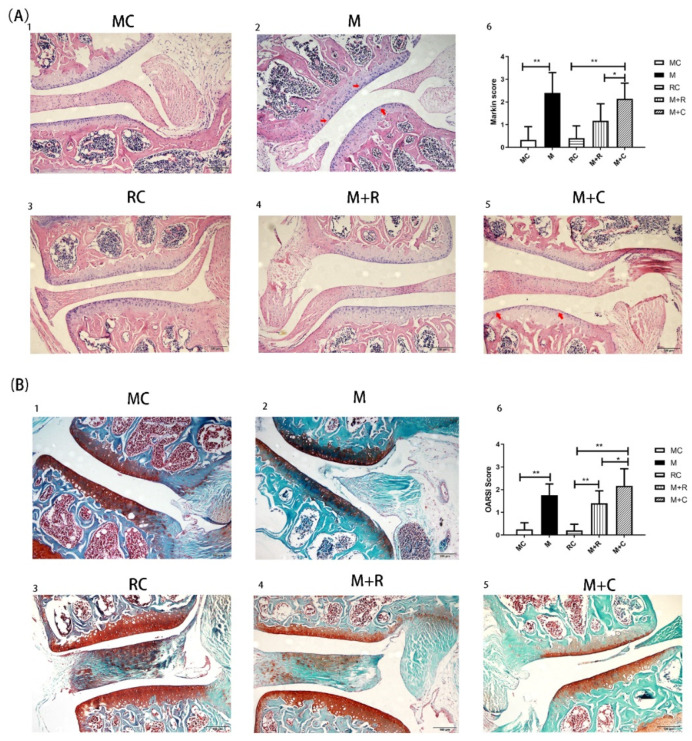
Figure 2.
Histological evaluation of joint tissue sections by HE and safranin O staining. (A) HE stained histological images of the knee joints; A(1): HE staining for MC group; A(2): HE staining for M group; A(3): HE staining for RC group; A(4): HE staining for M + R group; A(5): HE staining for M + C group; A(6): The Mankin score of each group; (B) Safranin-O-Fast Green stained histological images of the knee joints of mice; B(1): Safranin-O-Fast Green staining for MC group; B(2): Safranin-O-Fast Green staining for M group; B(3): Safranin-O-Fast Green staining for RC group; B(4): Safranin-O-Fast Green staining for M + R group; B(5): Safranin-O-Fast Green staining for M + C group; B(6): The Mankin score of each group. The red arrow indicates the site of cartilage damage. (n = 8, * p < 0.05, ** p < 0.01.).

