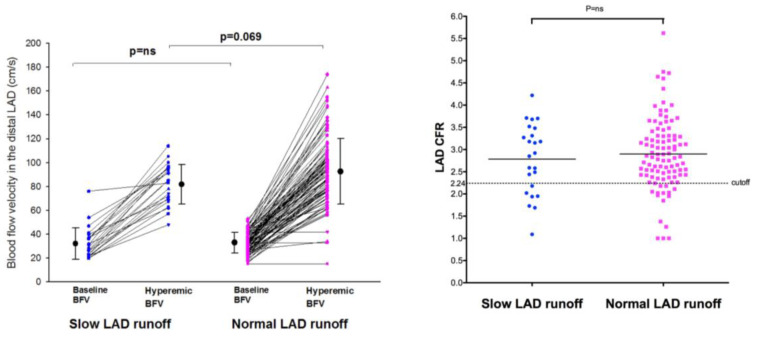
Figure 3.
Individual value bar graph of velocities and coronary flow reserve as assessed in the distal LAD in the SCFph group and in the control group. CFR was similar in the SCFph group with respect to the control (graph on the right). The hyperemic BFV, however, (graph on the left) tended to be a little bit lower in the SCFph patients than in the control, albeit this did not reach a statistical significance; mean values and SD are also drawn. BFV = blood flow velocity; CFR = coronary flow reserve; LAD = left anterior descending coronary artery; SD = standard deviation.

