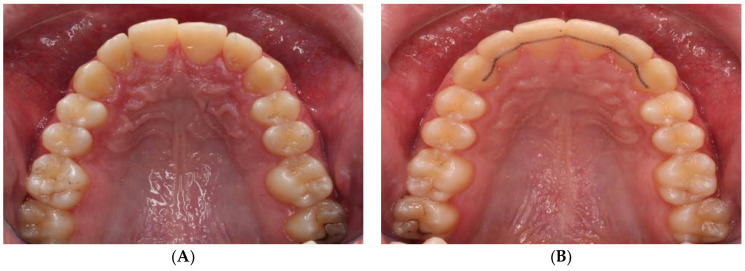
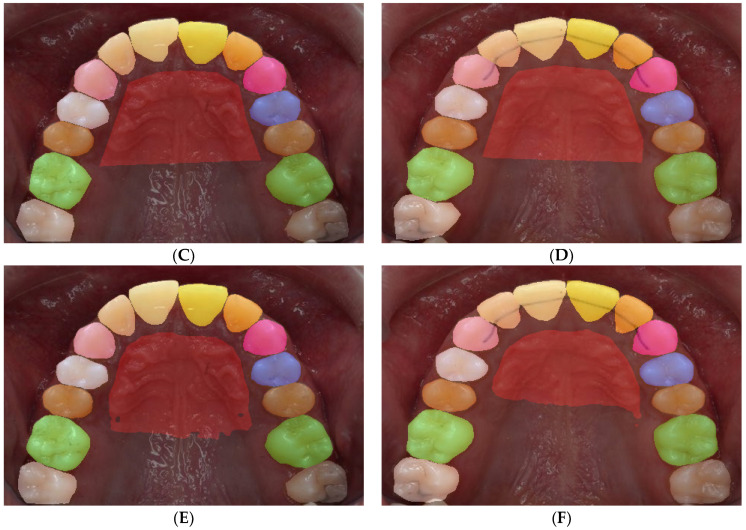
Figure A2.
The first column shows the original image (A) from the pre-treatment set, followed by its ground truth label (C) in the second row, and its prediction from the model in the third row (E). The second column shows the same order for an image as for the post-treatment of the same patient (B,D,F).


