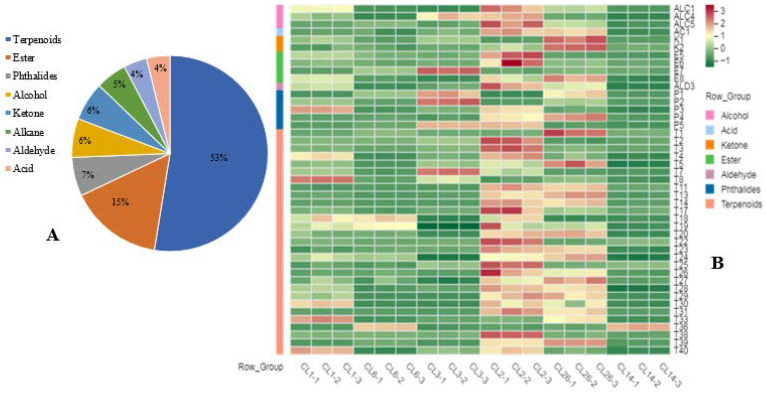
Figure 6.
The classification of volatile compounds (A) and the heat map of relative content of different volatile flavor compounds (B) in celery juice. All the relative contents normalized using z-score. The abbreviations of different volatile flavor compounds were show in Table S8.

