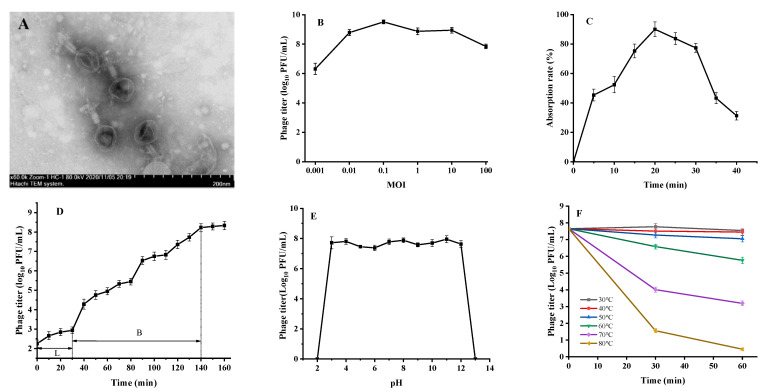
Figure 1.
Biological characteristics of phage L66. (A) Representative TEM image of phage L66. (B) Inhibition curves of phage L66 on Salmonella of different MOI. (C) Adsorption assay of phage L66. (D) One-step growth curve of phage L66, “L”: Latent period, “B”: Breakout period. (E) Tolerance of phage L66 against different pH and (F) Thermal conditions.

