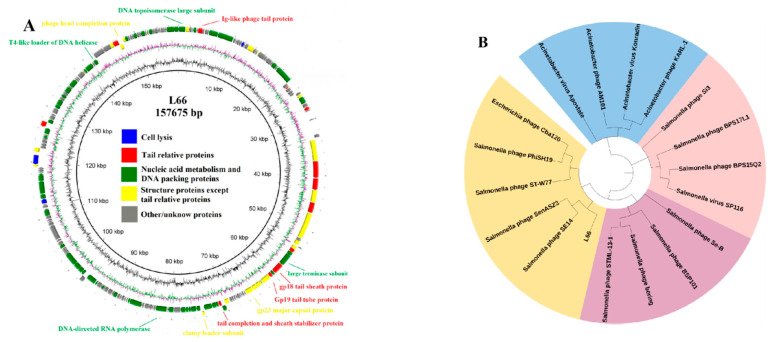
Figure 2.
Analysis of phage L66 genome. (A) Comparative circular genome map generated using BRIG Tool. The meaning of each circle from inside to outside: (1) Gene scale in bp; (2) GC content; (3) GC offset (offset value greater than zero is green, less than zero purple); (4) Genes located on the positive strand; (5) Genes located on the negative strand. (B) Phylogenetic analysis based on the terminase large subunit sequences from 18 phages using MEGA 7. Four clusters are indicated by blue, pink, purple, and yellow, respectively.

