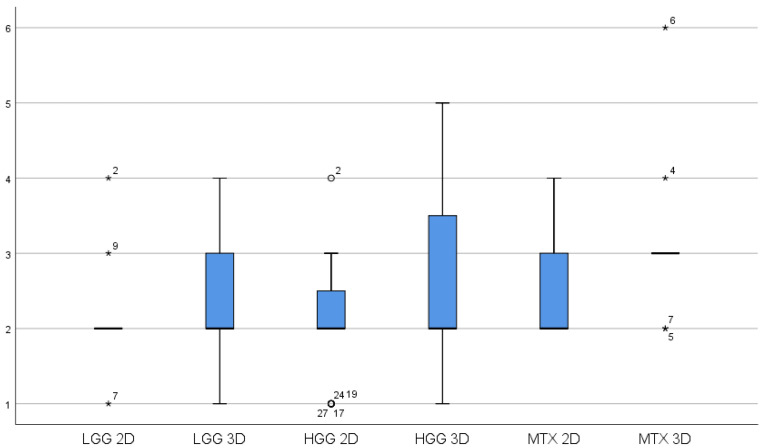
Figure 5.
Box plot showing 2D and 3D benefit variations for the three main categories of tumors: HGG = high-grade gliomas, LGG = low-grade gliomas, MTX = metastases. White circles = White circles = low potential outlier (more than 1.5 inter-quartile range at most 3 inter-quartile range. * = high potential outliers of more than 3 inter-quartile ranges).

