Table 1.
The structure and content of bioactive components in whole grains.
| Components | Structure | Derived Grains | Content (mg/kg) | References |
|---|---|---|---|---|
| γ-oryzanol |

|
Rice | 1550.0–8400.0 | [119] |
| Wheat | 297.0–584.0 | [120] | ||
| Corn | 200.0–250.0 | [120] | ||
| β-sitosterol |

|
Wheat | 365.6–673.1 | [124] |
| Barley | 510.0–676.0 | [51] | ||
| Quinoa | 76.0–556.0 | [39] | ||
| Oat | 210.0–409.2 | [39] | ||
| Alkylresorcinols |

|
|||
| Rye | 360.0–3200.0 | [108] | ||
| Wheat | 317.0–1732.0 | [108] | ||
| Ferulic acid |

|
Barley | 41.0–210.0 | [108] |
| Corn | 55.2 | [43] | ||
| Wheat | 472.0–813.8 | [40] | ||
| Barley | 41.0–210.0 | [108] | ||
| Quinoa | 126.8–281.7 | [42] | ||
| Brown rice | 7.1–52.7 | [50] | ||
| Rice | 155.6–271.1 | [41] | ||
| Oat | 1493.6 | [39] | ||
| p-coumaric acid |

|
Black rice | 84.8 ± 1.4 | [50] |
| Red rice | 176.9 ± 2.5 | [50] | ||
| Brown rice | 76.1–152.0 | [50] | ||
| Wheat | 23.8–35.6 | [40] | ||
| Barley | 0.8–58.4 | [51] | ||
| Quinoa | 31.3–42.0 | [42] | ||
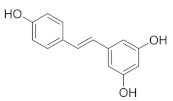
| Resveratrol |

|
Buckwheat | 5.7–7.9 | [54] |
| Quercetin |

|
Buckwheat | 3700.0 | [64] |
| Rice | 22.0–28.0 | [50] | ||
| Barley | 1.4–8.7 | [51] | ||
| Quinoa | 11.3–42.8 | [42] | ||
| Corn | 15.8 | [43] | ||
| Oat | 89.0 | [39] | ||
| Oligomeric procyanidins |

|
Black rice | 3500.0 | [74] |
| Red rice | 200.0 | [74] | ||
| Cyanidin-3-glucoside |

|
Wheat | 1590.0 | [78] |
| Rice | 2682.0–4700.0 | [50] | ||
| Purple corn | 1430.0 | [43] | ||
| Rye | 2270.0 | [78] | ||
| Barley | 1020.0 | [78] | ||
| Oat | 430.0 | [78] | ||
| Catechins |

|
Barley | 1312.47 ± 7.11 | [84] |
| Wheat | 355.87 | [83] | ||
| Buckwheat | 46.47 ± 0.17 | [84] | ||
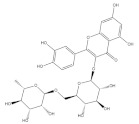
| Rutin |

|
Wheat | 236.2 | [93] |
| Quinoa | 609.1 | [94] | ||
| Buckwheat | 69.95 ± 2.25 | [84] | ||
| Carotenoids |

|
Corn | 9.69–13.0 | [101] |
| Wheat | 32.1–39.7 | [101] | ||
| Barley | 0.15–10.5 | [101] | ||
| Betaine |

|
Oat | 200.0–1000.0 | [132] |
| Wheat | 270.0–1110.0 | [132] | ||
| Rye | 444.0–2213.0 | [132] | ||
| Barley | 460.0–980.0 | [132] | ||
| Octacosanol |

|
Rice | 95.7 | [138] |
| Wheat | 0.4–8.9 | [139] | ||
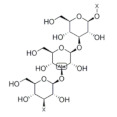
| β-glucan |

|
Rice | 140.0–570.0 | [114] |
| Barley | 4000.0–7000.0 | [108] | ||
| Oat | 51,800.0–282,000.0 | [39] | ||
| Rye | 1200.0–2900.0 | [108] | ||
| Wheat | 400.0–1400.0 | [108] | ||
| Tocotrienol |

|
Black rice | 31.9 ± 0.4 | [50] |
| Red rice | 36.9 ± 1.6 | [50] | ||
| Brown rice | 19.6 ± 0.4 | [50] | ||
| Wheat | 27.81 | [108] | ||
| Rye | 27.78 | [108] | ||
| Barley | 18.73 | [108] | ||
| Oat | 11.59 | [108] | ||
| Buckwheat | 54.6–552.2 | [39] |
