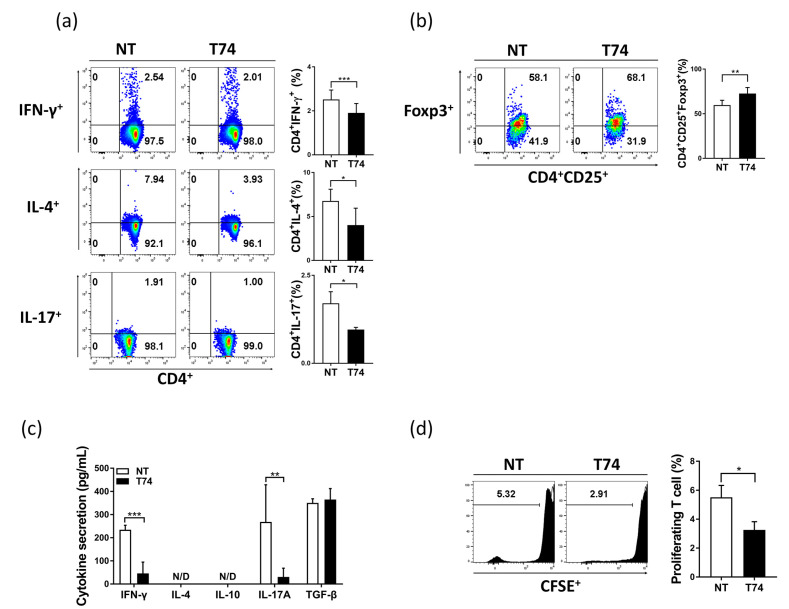
Figure 2.
Immunosuppressive characteristics of T74-DCs. Enriched T cells were co-cultured with each DC subset at a ratio of 1:10 for 72 h. (a) T cell subpopulations were analyzed by flow cytometry. The percentage of induced Th1 (CD4+IFN-γ+), Th2 (CD4+IL-4+), Th17 (CD4+IL-17A+), and (b) Treg (CD4+CD25+Foxp3+) is shown on the dot plots. (c) Th1/Th2/Th17- and Treg-related cytokine levels in supernatants from DC/T cell co-cultures were measured by ELISA. (d) CD3+ T cells were stained with CFSE to measure T cell proliferation. All data are representative of four independent experiments and are expressed as the mean ± SEM, n = 4. * p < 0.05, ** p < 0.01, *** p < 0.001. N/D: not detected.

