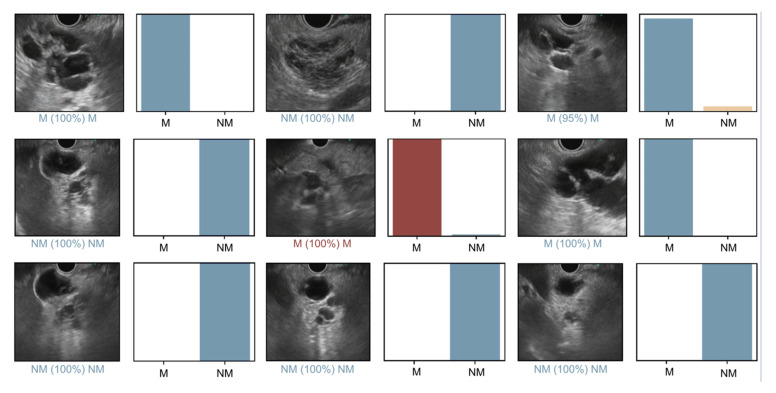
Figure 2.
Output provided during the validation phase of the convolutional neural network. The bars represent the probability estimated by the algorithm. The finding with the highest probability was outputted as the predicted classification. A blue bar represents a correct prediction. Red bars represent an incorrect prediction. M—mucinous pancreatic cystic lesion; NM—non-mucinous pancreatic cystic lesion.

