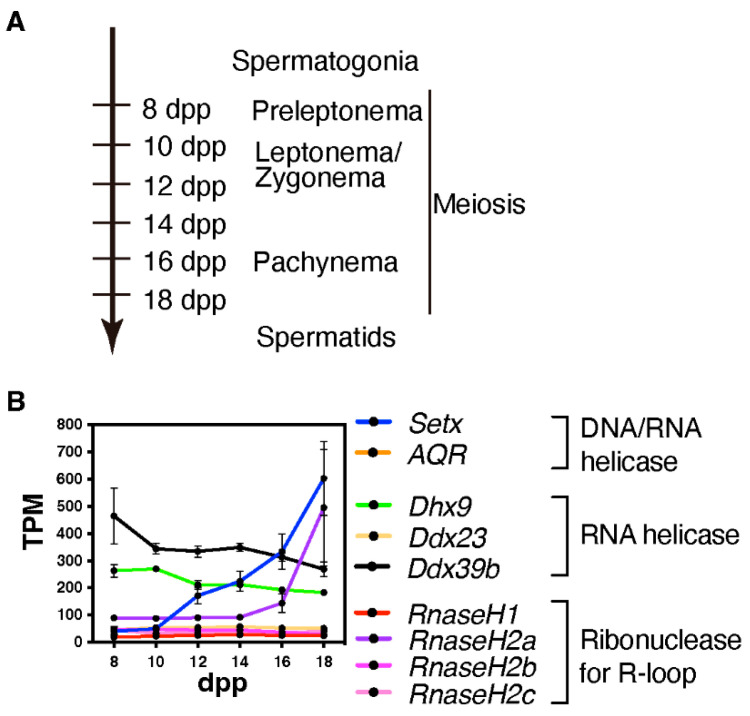
Figure 3.
Expression of R-loop-associated genes during the first wave of spermatogenesis. (A) This time-line indicates the predominant cell types in the testis at points during the first wave of spermatogenesis; dpp = days post partum (B) Line plot depicting the developmental pattern of the expression of R-loop-associated genes during the first wave of spermatogenesis; TPM = transcripts per million. Publicly available RNA-seq data were used to generate this plot (GSE72833) [34].

