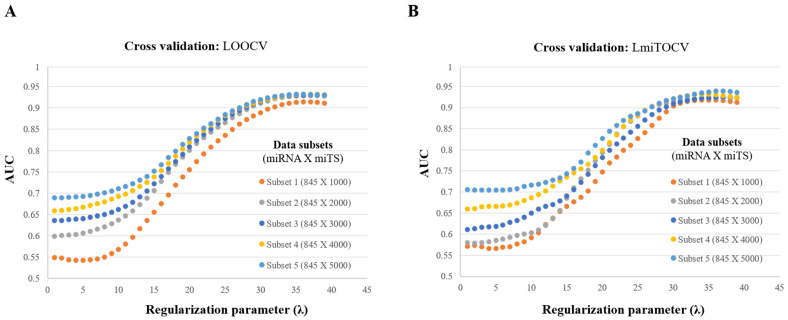
Figure A1.
AUC measurement after simulating mintRULS model on different values of regularization parameter (λ). The randomization in case of each dataset was iterated over 100 times and average AUC was calculated in (A) LOOCV, and (B) LmiTOCV environment. Definitions: Subset 1 (845 X 100) contains a matrix representing interactions among 845 miRNAs and 1000 miTS; and similarly, for other subsets.

