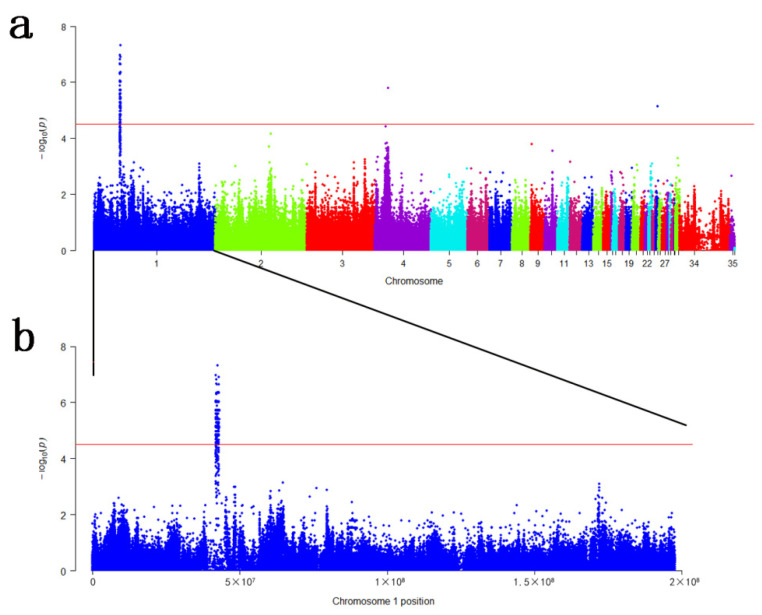
Figure 2.
Manhattan plots of GWAS for RIR stripe pattern. (a) Manhattan plot of all association bi-allelic variants (SNPs and INDELs) with the RIR stripe pattern; (b) Manhattan plot of GGA1 association bi-allelic variants (SNPs and INDELs) with the RIR stripe pattern. Manhattan plots indicate -log10(p) for variants (y-axis) against their positions on each chromosome (x-axis). Chromosomes 34 and 35 indicate Chromosome Z and W, respectively. The solid red line represents the genome-wide significant threshold (p = 3.07 × 10⁻⁵).

