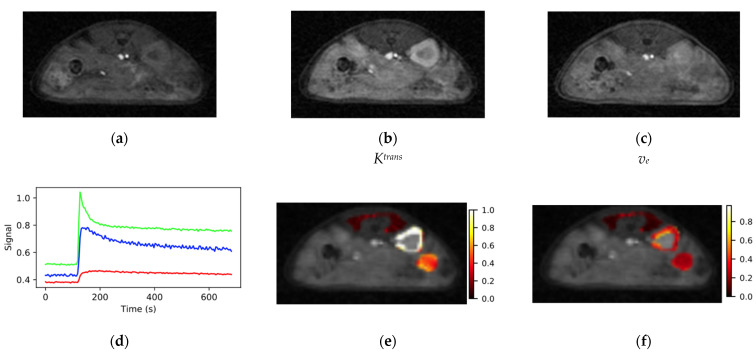
Figure 5.
Typical images from the SoS-DCE protocol (a) before bolus arrival, (b) at the bolus peak and (c) during washout are shown. (d) VOI response curves for muscle (red), kidney (green) and tumor (blue) had high SNR and the expected form. Maps of (e) Ktrans and (f) ve were elevated at the tumor periphery relative to the core. Color bar scales are min−1 for Ktrans and are unitless for ve.

