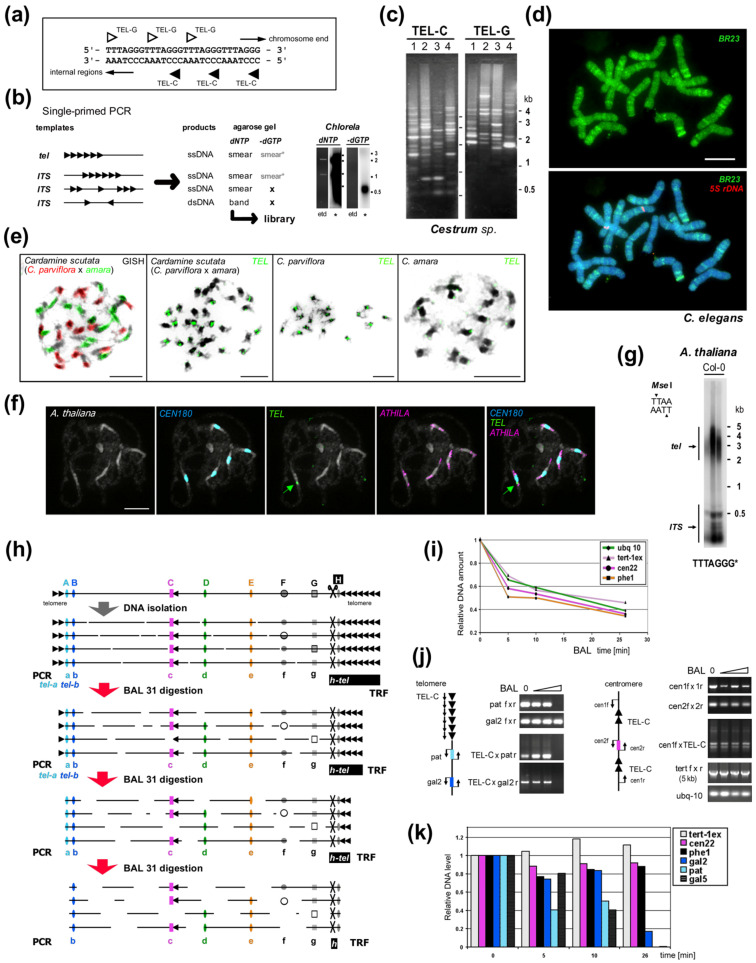
Figure 2.
Experimental examination of ITS and telomeric repeats. (a) Telomere repeats are strand oriented. (b) Telomere-like repeats in telomeres or internal sites may form clusters or short stretches. Single-primed PCR distinguishes between these using an extension reaction with a single telomeric oligonucleotide primer (C-rich primer is shown, triangles). Telomeric sequences, short and clustered ITSs produce a smear of ssDNA products visible after hybridization with a radioactively (*) labeled probe (right, e.g., from Chlorela vulgaris, experiment performed as in [135]). Cloneable dsDNA products visible in an ethidium-bromide stained agarose gel (etd) are produced when ITSs occur in head-to-head orientation. When dGTP is omitted, bands are not produced by ssDNA or short ITSs, but ssDNA from a telomere is elongated until primer extension stops at the first G in the subtelomere. This reaction showed the Arabidopsis- and human-type telomere repeats are absent in Allium and Cestrum [135,140,161]. (c) Different patterns of ITSs amplified from four Cestrum species in single-primed PCR using C-rich and G-rich primers for the Arabidopsis-type telomeric repeat [135,157]. (d) The specific pattern of ITS-associated sequence BR23 (green) was visualized on Cestrum elegans chromosomes using FISH. The high-copy repeat BR23 shows dispersed and clustered signals (5S rDNA in red, counterstained with DAPI; adapted from [157]). (e) Allotetraploid Cardamine scutata, a hybrid of C. parviflora and C. amara with the parental origin of chromosomes visualized by GISH (left panel, GISH) and telomeric probe (TEL) that detects differing pericentromeric ITS clusters (adapted from [159]; modified). (f) FISH of the 180-bp centromeric satellite (CEN180), retroelement ATHILA and TEL on pachytene chromosomes of A. thaliana. Interstitial telomeric locus in the pericentromeric region of chromosome Ch1 is marked by an arrow (adapted from [160]; modified). (g) TRF (terminal restriction fragment) method visualizes telomeric and ITS fragments from A. thaliana after restriction digestion of gDNA with MseI. (h) Schema illustrating the effect of Bal31 nuclease digestion on telomeric, subtelomeric, ITS and internal genomic sequences. After DNA isolation, DNA is fragmented and Bal31 nuclease gradually shortens these fragments from the end. Bal31-digested samples can be used for specific telomere-subtelomere PCR (left, see below). Further restriction digestion (right, H) results in the visualization of TRF signal (h-tel) shortening and verification of the terminal position of a candidate sequence. (Left) PCR/qPCR investigation of genomes with short telomeres (e.g., A. thaliana, see results in (i–k) adapted from [162]) proving subtelomeric position of candidate sequences (A,B). When the telomere is completely digested, PCR with a C-rich primer cannot amplify the product (tel-a, tel-b), and further digestion results in a loss of amplification signal from subtelomere regions proximal to telomeres (A) in contrast to ITS (C, pericentromeric ITS in A. thaliana, see schemas in (j)) or control sequences (D,E). Bal31 nuclease also degrades ssDNA (F) and some dsDNA sites with altered structures (G). (i) Dynamics of Bal31 digestion monitored by qPCR. Short gDNA exposure to Bal31 results in a sudden, seemingly non-specific decrease in gDNA amount followed by a gradual decrease over a prolonged time. (j) Bal31-sensitivity of specific subtelomeric sequences from chromosome arm 2R (pat and gal2) and the resistance of the centromeric ITS region to Bal31 digestion resolved by PCR. gDNA integrity was monitored by amplification of 5 kb-long fragments of the TERT gene. (k) qPCR analysis of specific subtelomere (gal2, pat, gal5), ITS and control sequences documented a decrease of subtelomeric sequences in relation to their position in the subtelomere. Relative DNA levels were calculated by the ΔCt method (i) or ΔΔCt method [163] using ubiquitine-10 as a reference gene relative to the nontreated DNA sample (k). Color coding is the same for (h–k). Pictures were adapted by courtesy of Dr. Terezie Mandáková (e,f) and Prof. Andrew Leitch (d), scale bars are 10 µm.

