Figure 3.
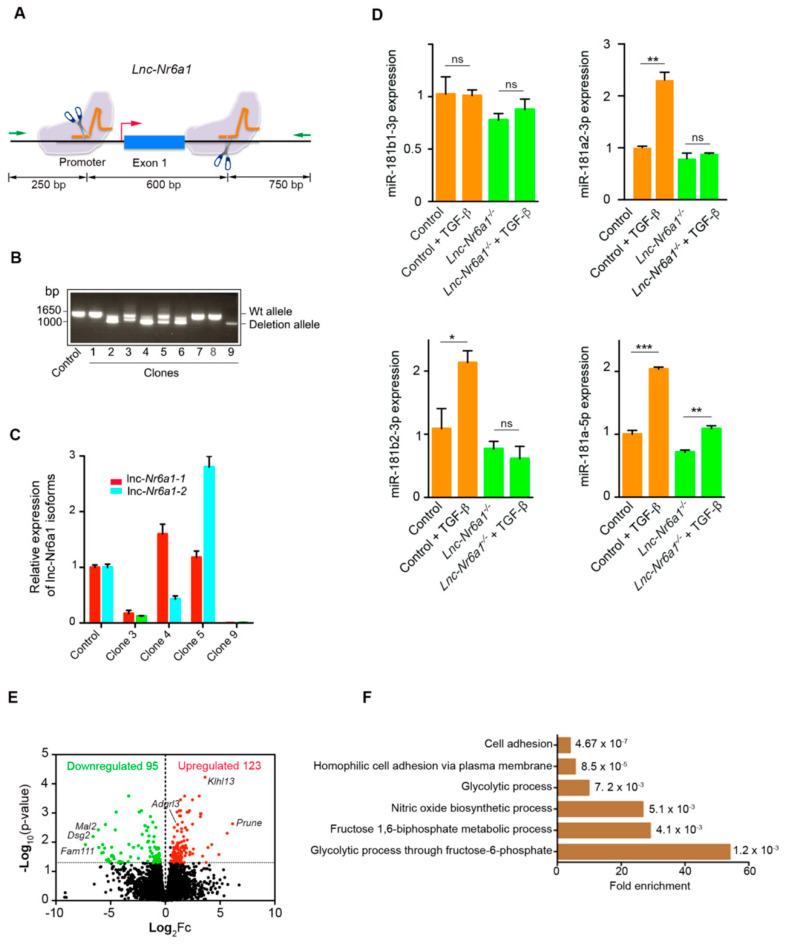
Deletion of a Lnc-Nr6a1 fragment in NMuMG cells and expression profile. (A) Scheme showing the 600 bp deleted fragment of Lnc-Nr6a1 deletion in NMuMG cells using CRISPR-Cas9 technology. Sites of cleavage by Cas9 in the promoter and first exon regions are indicated; primers (green arrows) for clones analysis are shown (B) Representative gel identifying non-deletion (control, clones 1, 7 and 8) monoallelic (clone 2, 3, 4, 5 and 6) and biallelic clones (clone 9). (C) Expression levels of lnc-Nr6a1 isoforms in different clones were measured by RT-qPCR analysis. (D) Expression of miR-181a/b species in control and Lnc-Nr6a1-depleted cells after 24 h of TGF-β treatment or untreated. Experiments were repeated twice in triplicate samples; error bars represent S.D. *** p < 0.001, ** p < 0.01, * p < 0.05, ns, not significant by two-tailed Student’s t-test. Y-axis of last panel (down right) is labeled 181a-5p because the isoforms miR-181a1-5p and miR-181a2-5p are identical. (E) Volcano plot for differentially expressed genes in Lnc-Nr6a1-depleted cells versus control cells. Genes upregulated with more than a 1.5-fold change with a p-value < 0.05 are depicted in red boxes and those downregulated with identical fold change and p-value are in green boxes. (F) Gene ontology enrichment analysis of downregulated genes in Lnc-Nr6a1-depleted cells.

