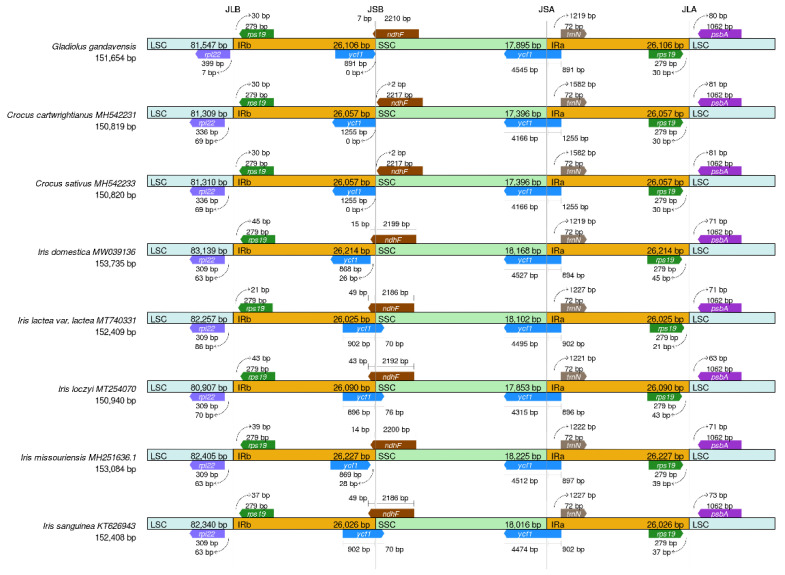
Figure 5.
The results of comparing the borders of the LSC, SSC, and IR regions among eight Iridaceae chloroplast genomes: I. lactea (MT740331), I. sanguinea (KT626943), I. loczyi (MT254070), I. missou-riensis (MH251636), C. sativus (MH542233), C. cartwrightianus (MH542231), and I. domestica (MW039136). Genes located at the IRa/b junctions are represented by colored boxes above (sense), while gene segments represent the boxes below (antisense) the horizontal line.

