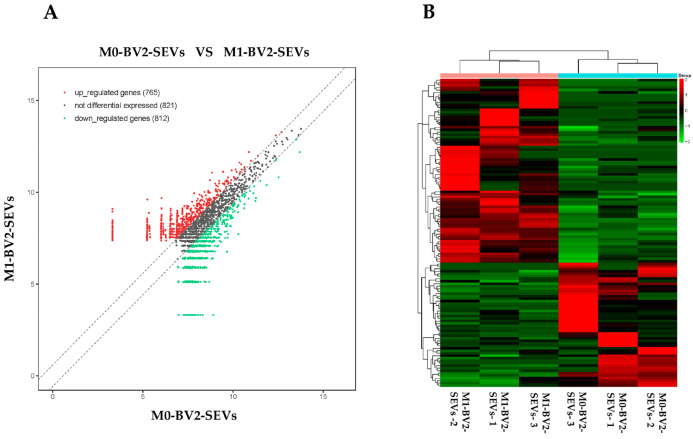
Figure 3.
High-throughput sequencing results of circRNAs in M0-BV2 SEVs (M0-BV2-SEVs) and the M1-BV2 SEVs (M1-BV2-SEVs). (A) The scatterplot generated using the R package “ggplot2” showed a total of 765 upregulated (red), 821 non-difference (black), and 812 downregulated (green) circRNAs. (B) The heat map generated using the R package “pheatmap” showed a clustering relationship of circRNAs expression.

