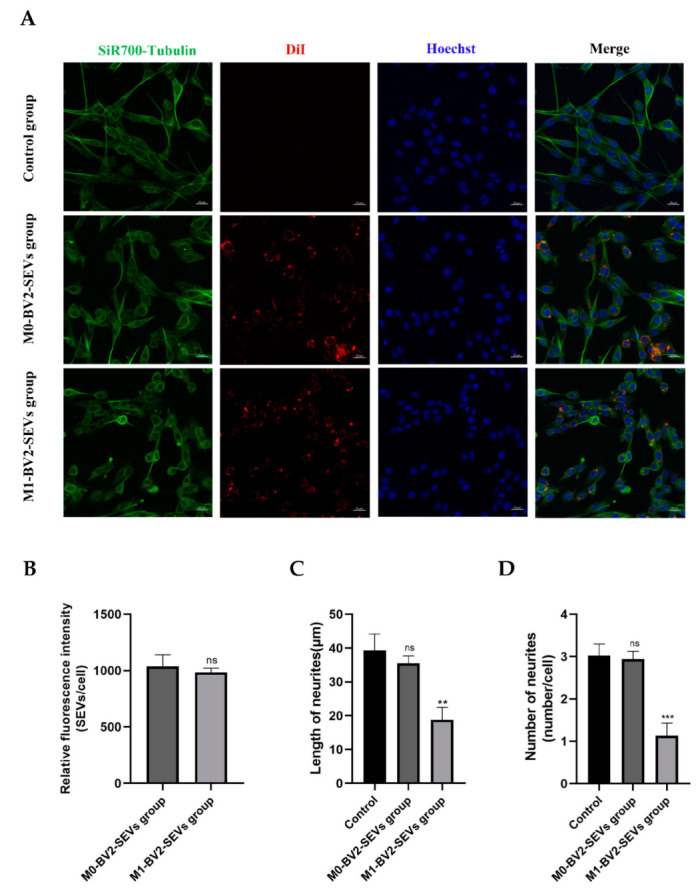
Figure 8.

Internalization of SEVs and changes to neurites. (A) M0-BV2 and M1-BV2 SEVs were stained with DiI (red), and the cell cytoskeleton (green) and nucleus (blue) were stained with the SiR700-tubulin Kit and Hoechst, respectively. Scale bar: 20 μm. (B–D) Quantitative analysis of the internalization of SEVs, as well as the length and number of neurites. Data are presented as the means ± SD of three independent experiments (** p < 0.01, *** p < 0.001).
