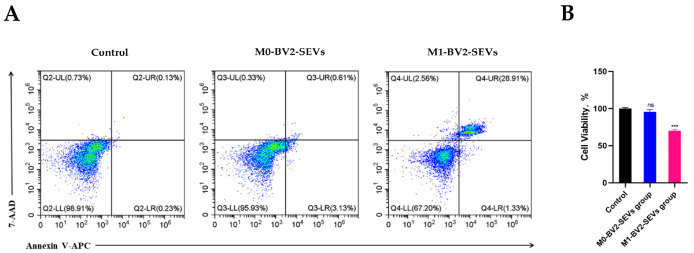
Figure 10.
The apoptosis rate and viability assay of neuronal PC12 cells following different treatments. (A) Results for the apoptosis rate of neuronal PC12 cells in the control, M0-BV2-SEVs, and M1-BV2-SEVs groups. (B) Cell viability results of the control, M0-BV2-SEVs, and M1-BV2-SEVs groups obtained using MTT assay. Data are presented as the means ± SD of three independent experiments (*** p < 0.001).

