Figure 5.
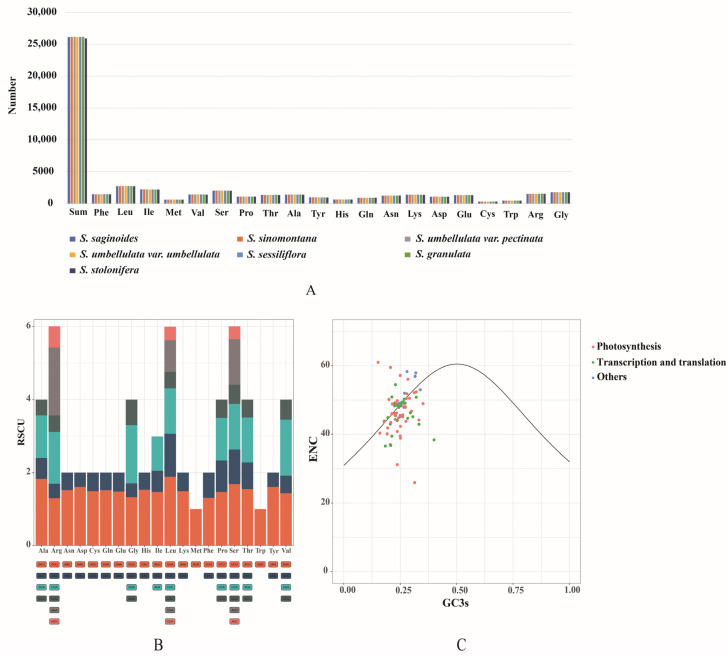
Usage preference of amino acids (AAs) and codons for PCGs. (A) AA usage of all the PCGs in each Saxifraga species. (B) RSCU for every AA in S. saginoides. For each amino acid, a color represents a unique codon. (C) ENC-GC3 plot for S. saginoides; every gene was displayed as a dot, and different colors mean genes in distinct functional groups.

