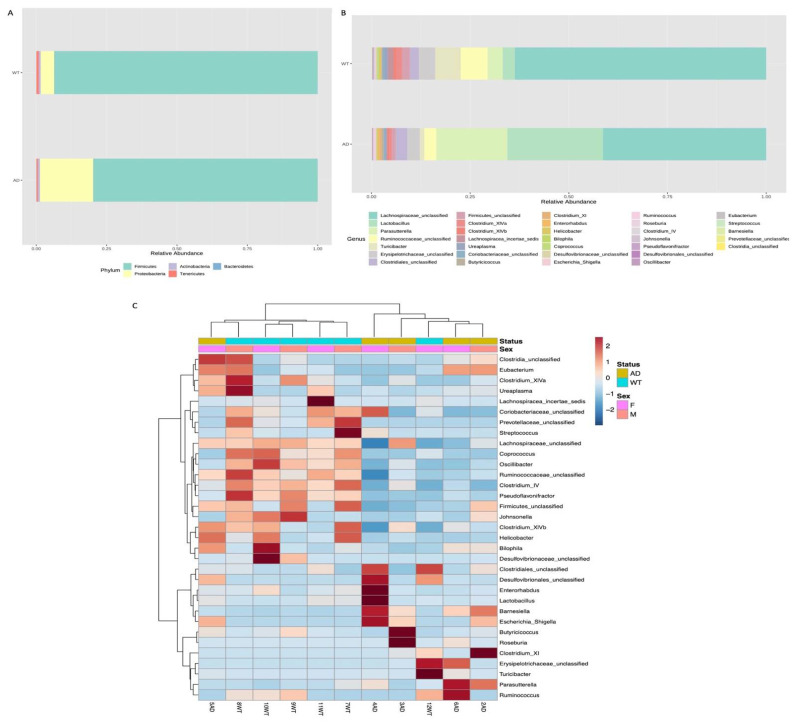
Figure 2.
Bacterial composition of AD and WT mice gut microbiome. Taxonomic assignment is shown at phylum (A) and genus (B) level. For each of these taxonomic levels, the barplots show the relative abundance (%) of each identified taxon/group. A different bacterial composition is highlighted both at phylum and at genus level. A heatmap of variance was obtained by grouping the reads based on the assigned taxa: a good cluster was obtained at genus level showing a clear separation between AD and WT mice (C).

