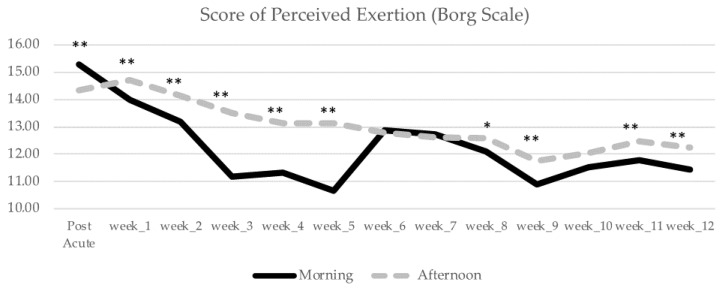
Figure 7.
Score of perceived exertion across different time-points (post-Acute T1 and at the end of the last session of each week of the 12-week intervention program, including T2, the final session) for the M and A groups. * Indicates significant differences between M and A for p < 0.05; ** Indicate significant differences between M and A for p < 0.01.

