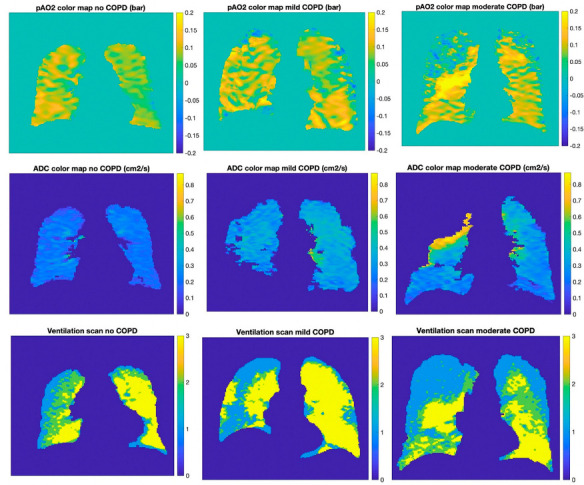
Figure 2.

Color maps of three subjects with different levels of disease severity. Left column: subject with no COPD, center column: mild COPD, right column: severe COPD; from top to bottom: pAO2 color map, ADC color map, ventilation scan. On the ventilation scans blue corresponds to non-ventilated regions, green hypo-ventilated and yellow normal.
