Figure 3.

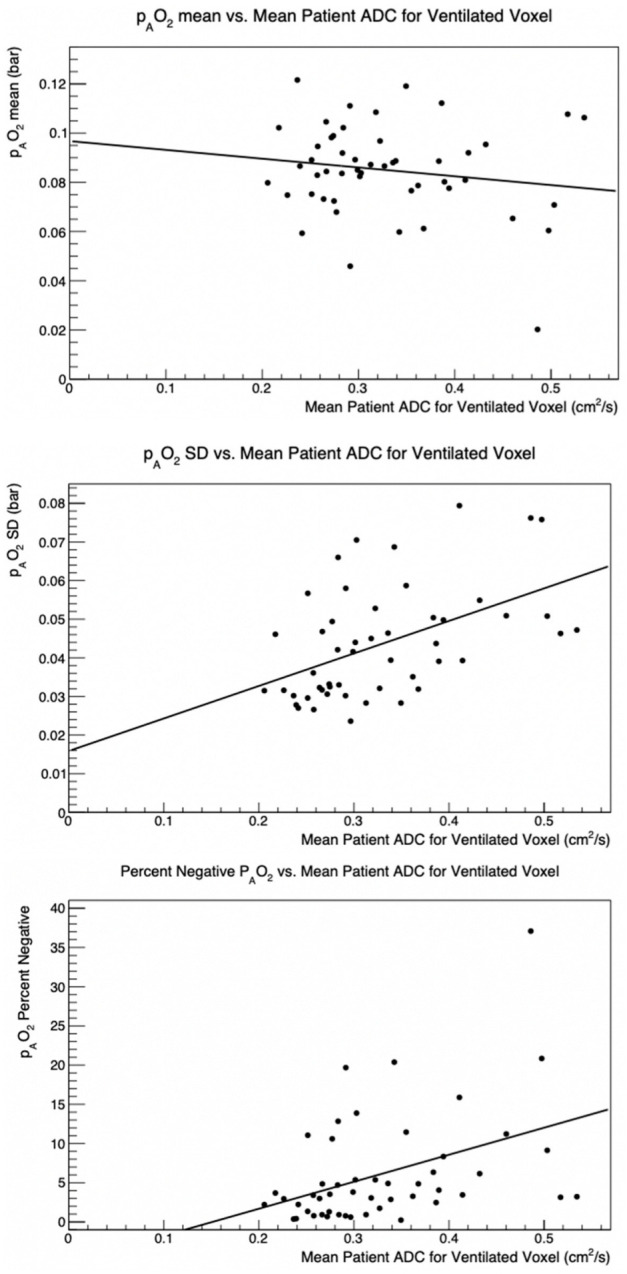
pAO2 mean vs. ADC mean (top), pAO2 SD vs. ADC mean (center) Percent negative pAO2 vs. ADC mean (bottom). Each measurement corresponds to an individual participant imaged with polarized 3He from the MESA COPD Study.

pAO2 mean vs. ADC mean (top), pAO2 SD vs. ADC mean (center) Percent negative pAO2 vs. ADC mean (bottom). Each measurement corresponds to an individual participant imaged with polarized 3He from the MESA COPD Study.