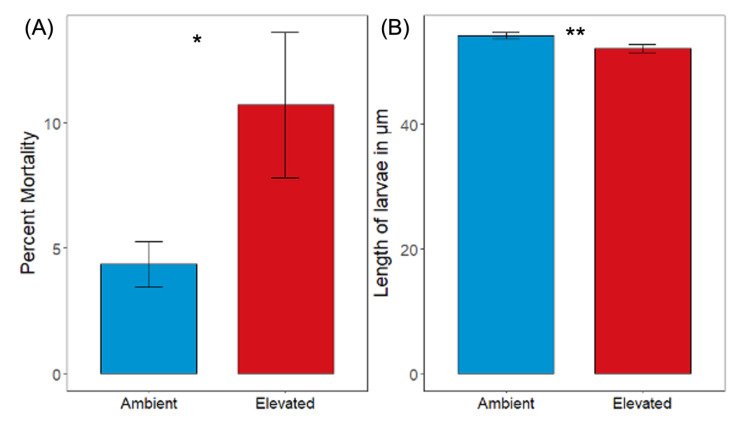
Figure 1.
(A) Percent mortality for 7 day old oyster larvae before transplantation into the alternative pCO2 treatment (* denotes significant difference for (A), G-test of independence, p < 0.001; n = 4, with a minimum of 100 larvae per replicate). Error bars are the 95% confidence intervals. (B) Length in micrometers for 7 day old oyster larvae before transplantation into the alternative pCO2 treatment in the reciprocal transplant experiment (** denotes significant difference for (B), Mann–Whitney U test, p < 0.001; n = 4, with a minimum of 65 larvae per replicate). Error bars denote standard error of the mean.

