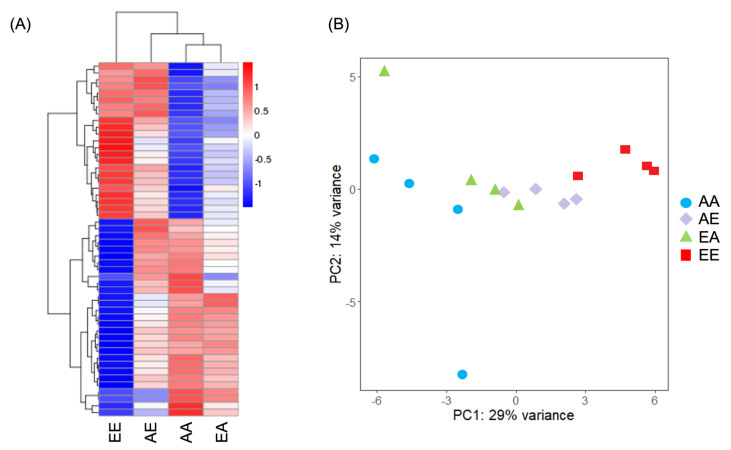
Figure 4.
(A) Hierarchical cluster analysis of DEGs (n = 4 replicates per treatment coalesced into 1 column). Over- and under-expressed genes are represented in red and blue, respectively. Data are normalized by average expression in all samples. (B) Principal component analysis of the normalized RNASeq data. Sample code names: first letter signifies original pCO2 treatment (A: ambient, E: elevated); second letter signifies final pCO2 treatment (first and second letters are different for transplanted treatments).

