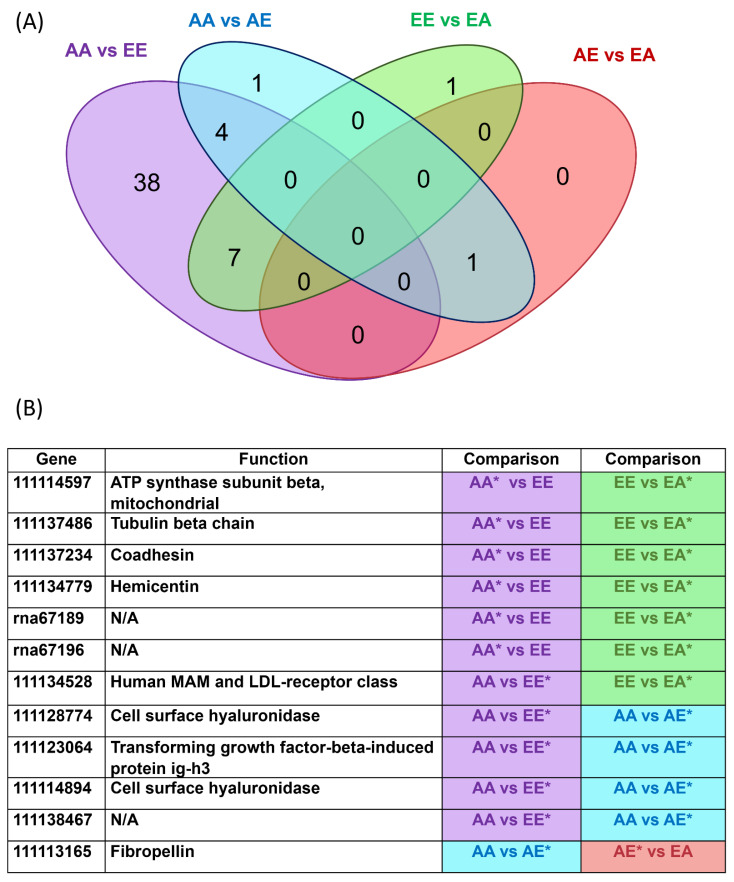
Figure 5.
(A): Venn diagram showing the number of genes uniquely expressed within each group, with the overlapping regions showing the number of genes that are expressed in two or more groups. (B) DEGs in common/shared between comparisons; * indicates the group with higher expression for the gene. Purple: AA vs. EE; Blue: AA vs. AE; Green EE vs. EA; Red: AE vs. EA.

