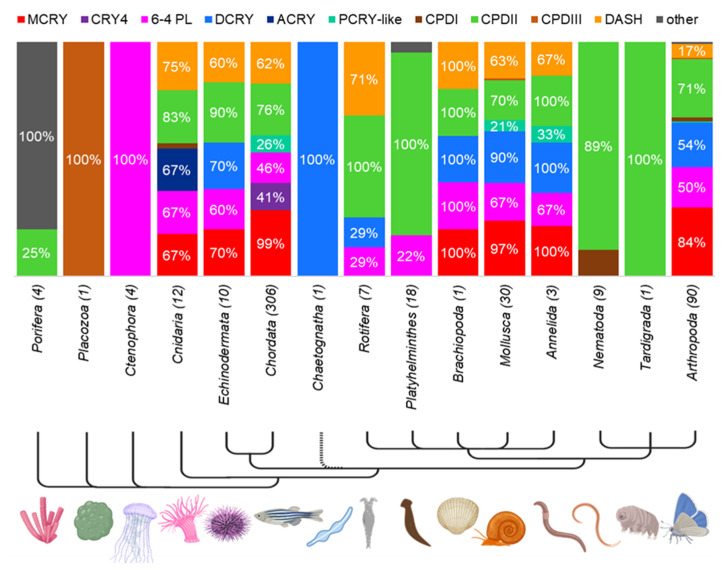
Figure 4.
CRY/PL distribution within the metazoan phylum. The prevalence of a subfamily within a phylum is indicated in percent, with only percentages > 10% shown for clarity. The total number of animals examined in each phylum is given in parentheses beside the phylum name. See Supplementary Materials S8 for more details.

