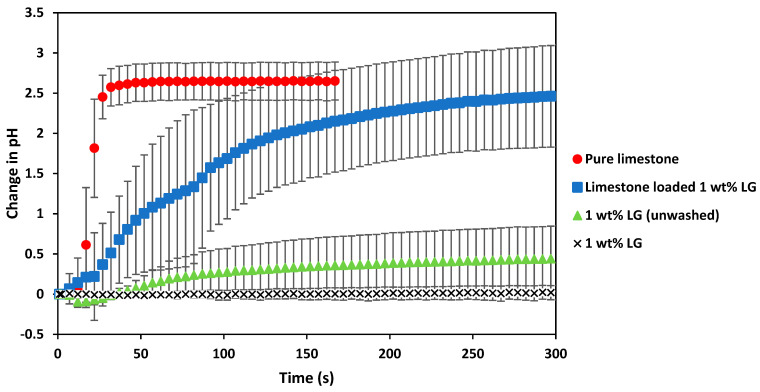
Figure 5.
Change in pH over time with the addition of pure limestone (●), 1 wt% laboratory-grade alginate hydrogels (no CaCO3 addition) (▲), 1 wt% laboratory-grade alginate hydrogels (no CaCO3 addition and washed) (×) and hydrogels with added CaCO3 (■). Error bars show the standard deviation between triplicate experimental runs. ANOVA analysis with a significance of 0.05 was applied to the equilibrium results.

