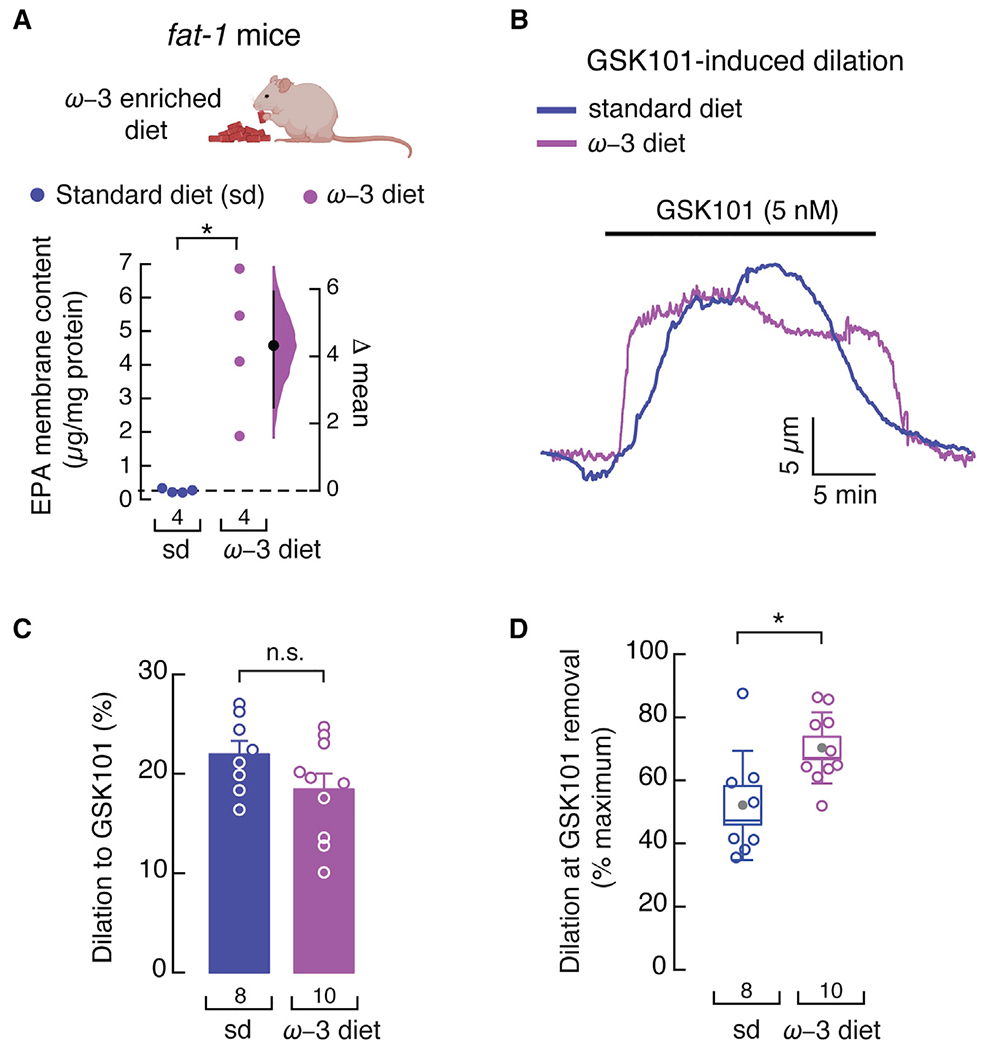
Figure 5. An ω-3 enriched diet decreases TRPV4-mediated vasodilation decay in fat-1 mouse arteries.

(A) Gardner-Altman estimation plot showing the mean difference in EPA-membrane content of whole mesenteric arteries from fat-1 mice fed with standard or ω-3 fatty acid-enriched diets, as determined by LC-MS. The raw data are plotted on the left axis. The mean difference, on the right, is depicted as a dot; the 95% confidence interval is indicated by the ends of the vertical error bars. n is denoted below the circles. Mann-Whitney rank test for two independent groups. Mouse cartoon was created with BioRender.com.
(B) Representative time course of GSK101 (5 nM)-induced vasodilation of pressurized (80 mmHg) mesenteric arteries from fat-1 mice fed with standard or ω-3 fatty acid-enriched diets.
(C) Percentage of GSK101 (5 nM)-induced vasodilation of mesenteric arteries from fat-1 mice fed with standard or ω-3 fatty acid-enriched diets. Bars are mean ± SEM. Two-tailed unpaired t test.
(D) Boxplots show the mean (gray circle), median (bisecting line), SD (whiskers), and SEM (box) of the percentage of maximal GSK101 (5 nM)-induced vasodilation remaining at the time GSK101 was removed from the mesenteric arteries of fat-1 mice fed with standard or ω-3 fatty acid-enriched diets. Two-tailed unpaired t test. Asterisks indicate values significantly different from the standard diet (*p < 0.05) and n.s. indicates values not significantly different from the standard diet. n is indicated in each panel. See also Figure S5.
