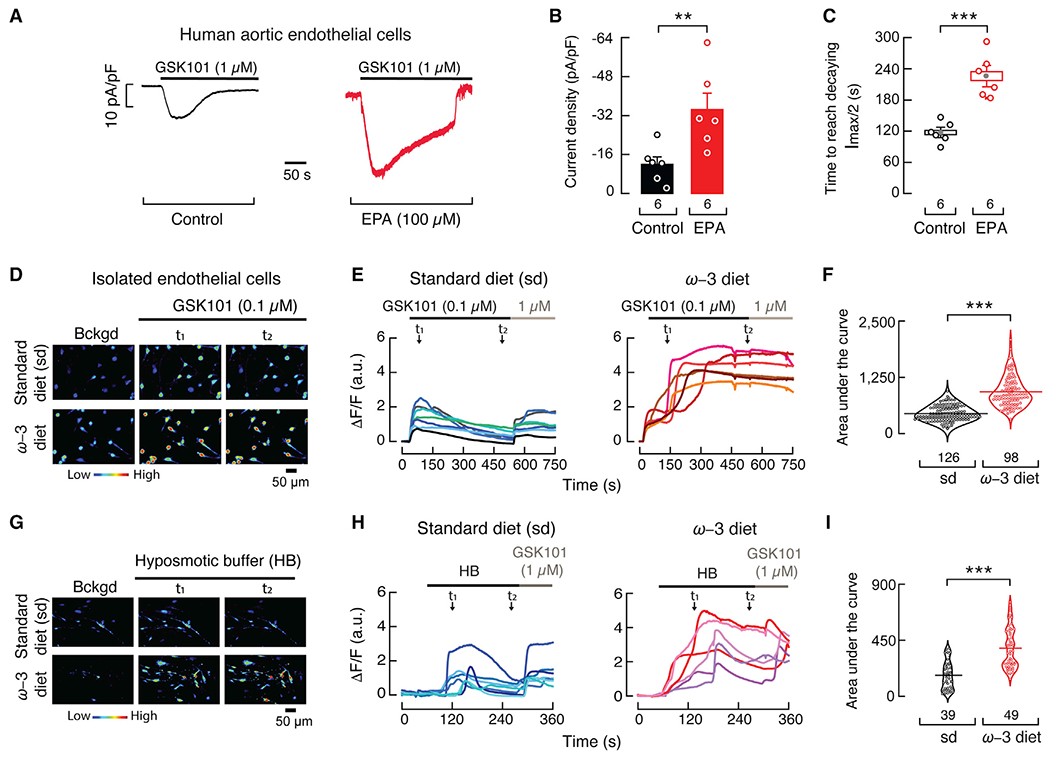
Figure 6. EPA supplementation decreases TRPV4 desensitization.

(A) Representative time course of whole-cell patch-clamp recordings (−60 mV) of control and EPA (100 μM)-treated human aortic endothelial cells challenged with GSK101 (1 μM).
(B) Bar graph displaying TRPV4 currents (pA/pF) obtained by whole-cell patch-clamp recordings (−60 mV) of control and EPA (100 μM)-treated aortic endothelial cells. Bars are mean ± SEM. Mann-Whitney rank test for two independent groups.
(C) Boxplots show mean (gray circle), median (bisecting line), SD (whiskers), and SEM (box) of the time to reach half amplitude from the peak current (Imax) elicited by GSK101 (1 μM) in control and EPA (100 μM)-treated aortic endothelial cells. Two-tailed unpaired t test.
(D) Micrographs of cultured isolated mesenteric endothelial cells from WT mice fed with standard or ω-3 fatty acid-enriched diets, loaded with Fluo-4 AM, and challenged with GSK101 (0.1 μM). The color bar indicates a relative change in fluorescence intensity. Experiments were performed in three independent cell preparations. t indicates the times at which representative micrographs were taken from the traces in (E).
(E) Representative traces corresponding to normalized intensity changes (ΔF/F) of individual cells shown in (D).
(F) Area under the curve (AUC) of the fluorescence response (ΔF/F), depicted as violin plots with the means shown as horizontal bars, of endothelial cells from WT mice fed with standard or ω-3 fatty acid-enriched diets challenged with GSK101. Two-tailed unpaired t test.
(G) Micrographs of cultured isolated mesenteric endothelial cells of WT mice fed with standard or ω-3 fatty acid-enriched diets, loaded with Fluo-4 AM and challenged with a hypoosmotic buffer (HB: 240 mOsm). The color bar indicates a relative change in fluorescence intensity. Experiments were performed in two independent cell preparations. t indicates the times at which representative micrographs were taken from the traces in (H).
(H) Representative traces corresponding to normalized intensity changes (ΔF/F) of individual cells shown in (G).
(I) AUC of the fluorescence response (ΔF/F), depicted as violin plots with the means shown as horizontal bars, of endothelial cells from WT mice fed with standard or ω-3 fatty acid-enriched diets challenged with a hypoosmotic buffer. Two-tailed unpaired t test. Asterisks indicate values significantly different from control or standard diet (***p < 0.001 and **p < 0.01). n is indicated in each panel.
