Figure 3.
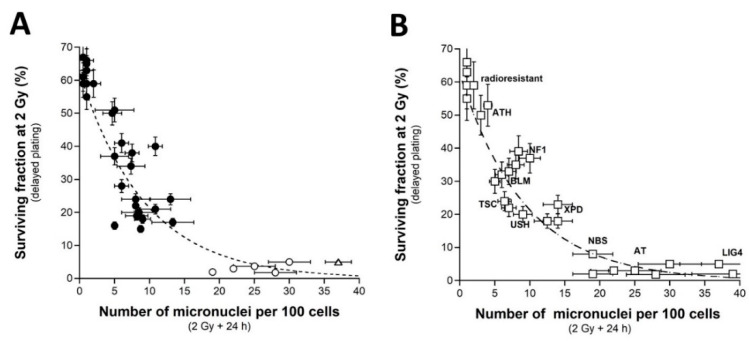
SF2 vs. micronuclei. (A) The SF2 data from 36 COPERNIC cell lines were plotted against the corresponding number of micronuclei per 100 cells assessed 24 h post-irradiation (closed circles). Each point corresponds to the mean ± standard error of the mean (SEM) of three independent triplicates, at least. The best data fit was obtained with the linear law: SF2 (%) = 62.2 exp (−0.107 MN24h); r2 = 0.939 (dotted line). The points corresponding to the ATM- (open circles) and the LIG4- (open triangles) mutated cell lines are indicated. (B) The SF2 values (±SEM) and the corresponding numbers of micronuclei per 100 cells assessed 24 h post-irradiation (±SEM) from fibroblasts deriving from patients suffering from the indicated syndromes (open squares) (AT: ataxia telangiectasia, homozygous mutations of ATM; LIG4: homozygous mutations of LIG4; NBS: Nijmegen’s syndrome, homozygous mutations of NBS1; XPD, xeroderma pigmentosum D, homozygous mutations of XPD; USH, Usher’s syndrome, homozygous mutations of USH; TSC, tuberous sclerosis, heterozygous mutation of TSC; Bloom’s syndrome, homozygous mutations of BLM; NF1, neurofibromatosis type 1, heterozygous mutations of neurofibromin; ATH, heterozygous mutations of ATM. The dotted line is the reproduction of the data fit shown in (A). The syndromes data were obtained from our lab and published elsewhere [3,15,30,43].

