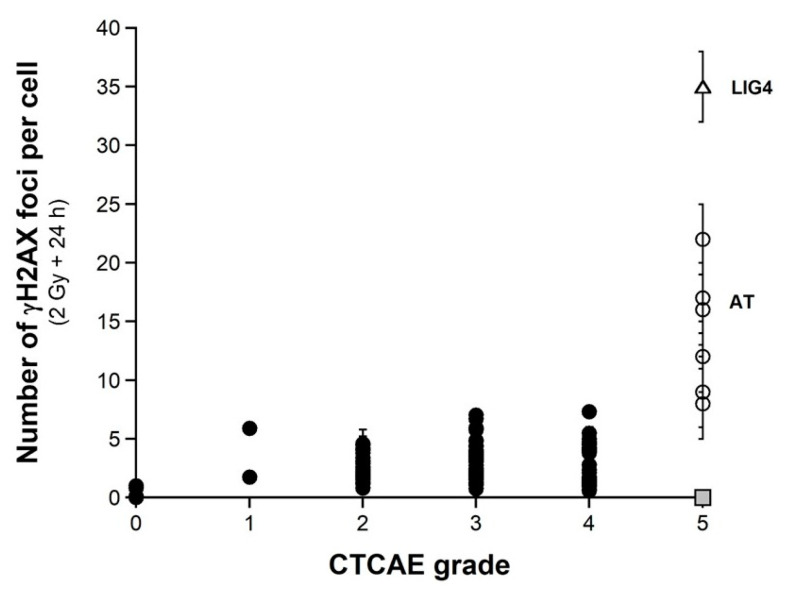
Figure 4.
γH2AX foci vs. CTCAE grades. The number of γH2AX foci assessed 24 h post-irradiation from 200 COPERNIC cell lines were plotted against the corresponding CTCAE grade values (closed circles). Each point corresponds to the mean ± standard error of the mean (SEM) of three independent triplicates, at least. The points corresponding to the ATM- (open circles) and the LIG4- (open triangles) mutated cell lines are indicated. The grey square indicates all the AT data if considering γH2AX foci in ATM-mutated cells as absent.

