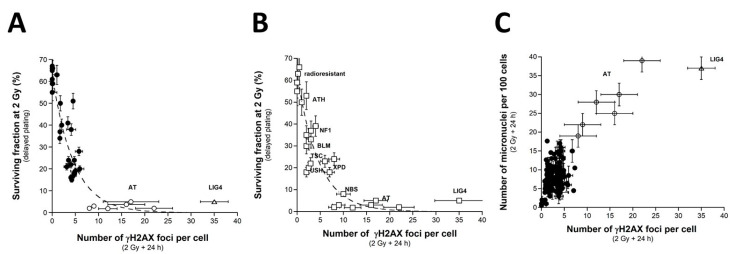
Figure 5.
SF2 vs. γH2AX foci and micronuclei vs. γH2AX foci (A) The SF2 data from 36 COPERNIC cell lines were plotted against the corresponding number of γH2AX foci per cell assessed 24 h post-irradiation (closed circles). Each point corresponds to the mean ± standard error of the mean (SEM) of three independent triplicates, at least. The best data fit was obtained with the linear law: SF2 (%) = 62.56 exp (−0.216 H2AX24h); r2 = 0.87 (dotted line). (B) The SF2 values (±SEM) and the γH2AX foci assessed 24 h post-irradiation (±SEM) from fibroblasts deriving from patients suffering from the indicated syndromes (open squares) (AT: ataxia telangiectasia, homozygous mutations of ATM; LIG4: homozygous mutations of LIG4; NBS: Nijmegen’s syndrome, homozygous mutations of NBS1; XPD, xeroderma pigmentosum D, homozygous mutations of XPD; USH, Usher’s syndrome, homozygous mutations of USH; TSC, tuberous sclerosis, heterozygous mutation of TSC; Bloom’s syndrome, homozygous mutations of BLM; NF1, neurofibromatosis type 1, heterozygous mutations of neurofibromin; ATH, heterozygous mutations of ATM). The dotted line is the reproduction of the data fit shown in (A). The syndromes data were obtained from our lab and published elsewhere [3,15,30,43]. (C) The number of micronuclei assessed 24 h post-irradiation shown in Figure 2A (from 200 COPERNIC cell lines) was plotted against the corresponding numbers of γH2AX foci per cell assessed 24 h post-irradiation shown in Figure 4. The points corresponding to the ATM- (open circles) and the LIG4- (open triangles) mutated cell lines are indicated.

