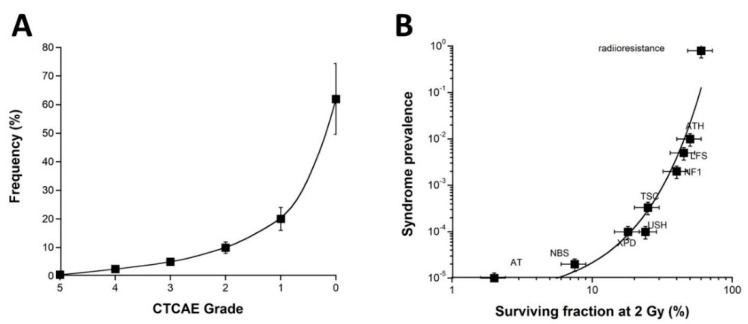
Figure 8.
(A) Frequency of the OR as a function of the CTCAE grades. These data were established from the COPERNIC collection ([43] and N.F. personal communication). (A) A 20% relative error was applied to all the data. The best data fit was obtained with an exponential law. (B) Prevalence of the indicated genetic syndromes associated with radiosensitivity as a function of SF2 data [43]. These data have been published in a previous report in another form. Error bars were built on the basis of 20% relative error for SF2 and prevalence, respectively. (AT: ataxia telangiectasia, homozygous mutations of ATM; NBS: Nijmegen’s syndrome, homozygous mutations of NBS1; XPD, xeroderma pigmentosum D, homozygous mutations of XPD; USH, Usher’s syndrome, homozygous mutations of USH; TSC, tuberous sclerosis, heterozygous mutation of TSC; NF1, neurofibromatosis type 1, heterozygous mutations of neurofibromin; LF2, Li-Fraumeni’s syndrome, heterozygous mutations of p53; ATH, heterozygous mutations of ATM). The best data fit was obtained with an exponential law.

