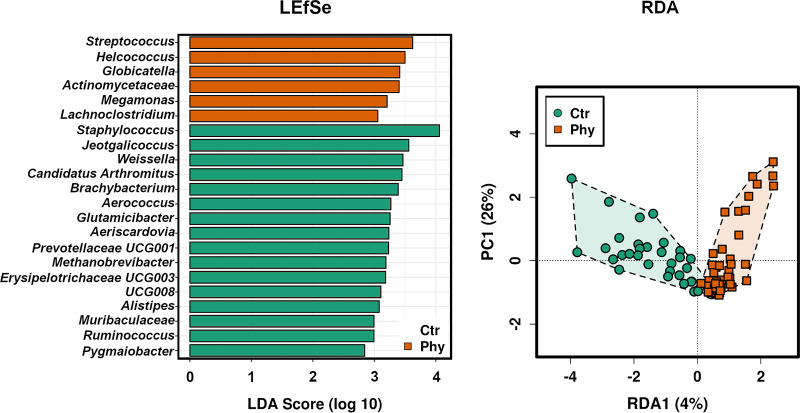
FIG 5.
LEfSe (left) and RDA (right) plot comparing the chicken cloacal samples of the flocks fed with a control diet (Ctr) and groups supplemented with phytogenic treatment (Phy). Linear discriminant analysis (LDA) score was scaled into log10, and SILVA taxonomy was compared to allocate the specific genera.

