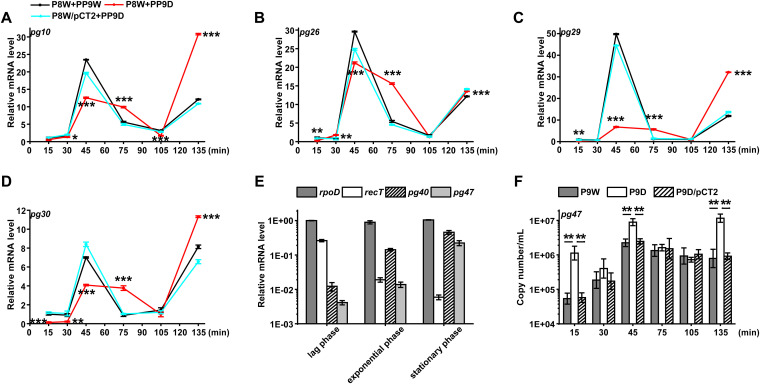
FIG 5.
RT-qPCR assay. (A to D) for different gene transcription curves of P8W or P8W/pCT2 infected with phage PP9W or PP9D (without recT). The black line indicates the control group, and the red line represents the treatment group. P8W/pCT2 + PP9D (cyan line) stands for the complementation group. (A) pg10 encodes the phage tail tip protein. (B) pg26 encodes the head decoration protein. (C) pg29 encodes terminase large subunit. (D) pg30 encodes terminase small subunit. (E) Gene expression levels of P9W in different growth phases. (lag phase: 1 h; exponential phase: 8 h; stationary phase: 20 h). The dark gray bar indicates rpoD (the host reference gene). The blank bar stands for recT. The striate-filled bar represents pg40 (encodes a CI-like repressor protein C). The light gray bar shows pg47 (encodes a protein containing a CsrA domain). (F) Absolute quantification of pg47 in different strains at lag phase indicated by the corresponding bars above. The experiments were independently replicated three times, and each sample was tested in triplicate. Data were analyzed by one-way analysis of variance (ANOVA) with Tukey’s multiple comparisons (α < 0.05) to examine the mean differences between the data groups. *, P < 0.05; **, P < 0.01; ***, P < 0.001. Error bars show standard deviations.

