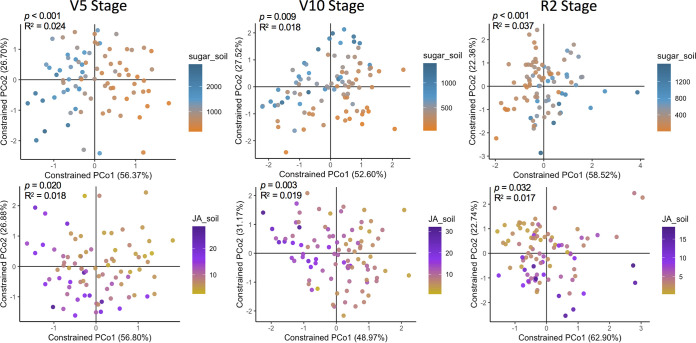
FIG 5.
Specific growth stages in which the rhizobacterial communities were affected by different jasmonic acid and sugar concentrations quantified in the rhizosphere field samples. Shown are the constrained principal coordinates analysis (CAP) results based on the Bray-Curtis distance matrices showing the separation of samples according to the concentrations of sugars and jasmonic acid quantified from rhizosphere samples collected in the field. PERMANOVA P values and R2 values are shown in each graph to indicate the significance and effect size of sugars and jasmonic acid concentration on the rhizosphere bacterial community structure at each growth stage. Sugars and jasmonic acid concentration were used as numeric factors in the multivariate analyses. Each sample had a corresponding value of sugars and jasmonic acid concentration as quantified in the rhizosphere field samples. The variation range of sugars and jasmonic acid concentration (ng soil g−1) is shown in the legends of each graph. The graphs showing the separation of samples according to the different concentrations of total sugars or jasmonic acid were constrained for the factors sugar and jasmonic acid concentration. PCo, principal coordinate analysis.

