Figure 3.
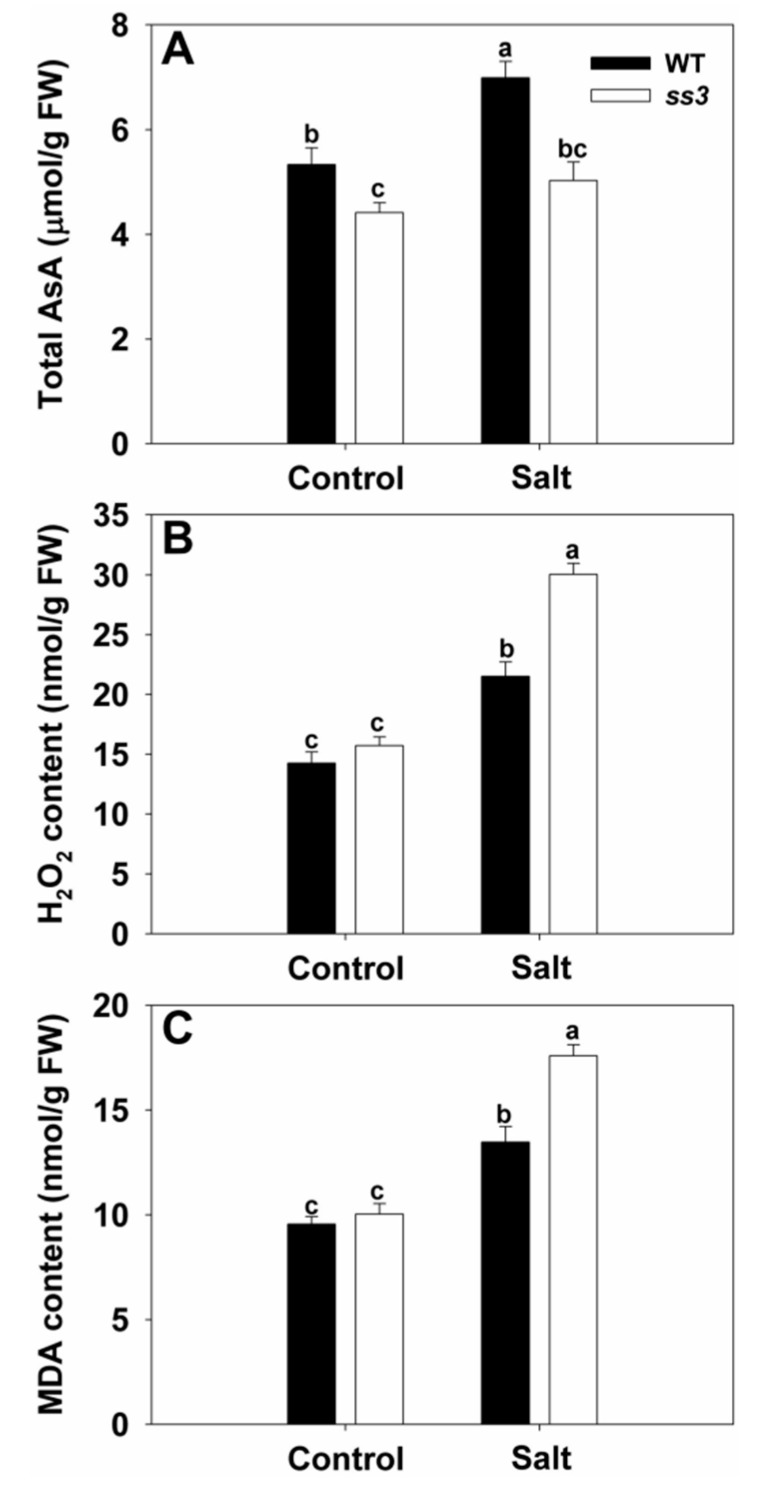
ROS accumulation in response to salinity stress in ss3 mutant compared with WT. Growth conditions and treatments were the same as described in Figure 1. The AsA content (A), H2O2 content (B), and MDA content (C) are shown. The values are means ± SE of five replicates. Significant differences at p < 0.05 are indicated with different letters. FW—fresh weight.

