Figure 6.
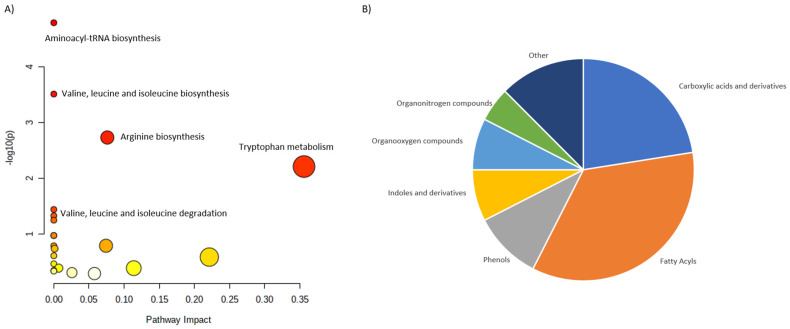
Characterization of metabolites altered in vitamin D3 deficiency. (A) shows the main pathways, built for the discriminating metabolites reported in review publications. (B) shows pie chart, illustrating the distribution of the discriminating metabolites across different metabolite classes. Second largest group of metabolites are Carboxylic acids and derivatives, followed by Phenols, Indoles and derivatives and Organooxygen compounds. The location of these metabolites in the metabolic pathways showed high alterations in the amino acids’ metabolism. Tryptophan metabolism, Arginine biosynthesis and Valine, leucine and isoleucine biosynthesis together with Amino-tRNS biosynthesis were the most impacted pathways.

