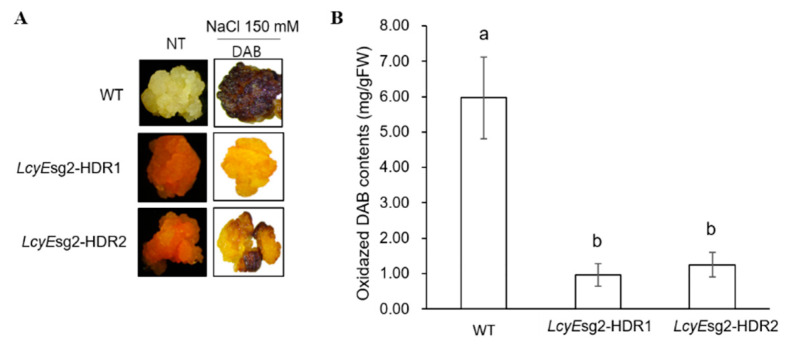
Figure 4.
Salt-induced oxidative stress in the WT, LcyEsg2-HDR1, and LcyEsg2-HDR2 lines was visualized by DAB staining in rice. (A) Visible damage in the WT, LcyEsg2-HDR1, and LcyEsg2-HDR2 lines after stress treatment with 150 mM NaCl by DAB staining. NT: picture of the calli of each line before salt treatment. (B) Oxidized DAB contents in the WT, LcyEsg2-HDR1, and LcyEsg2-HDR2 lines incubated at 150 mM NaCl. Bars indicate the standard error of the mean.

