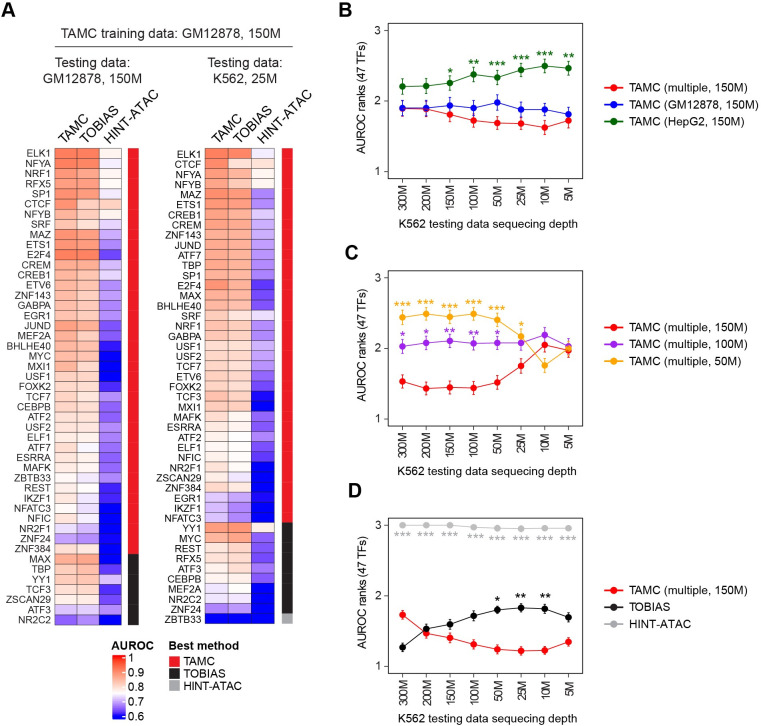
Fig 2. TAMC outperforms existed methods.
(A) Heat maps compare intra-data (left) and cross-data (right) classification performance of TAMC with TOBIAS and HINT-ATAC. Test data are indicated above each heatmap, and TAMC models were trained using GM12878 ATAC-seq data with 150M sequencing depth in both heatmaps. (B) Line graph compares cross-data classification performance of TAMC models trained on ATAC-seq data of GM12878, HepG2 and multiple (GM12878 and HepG2) cell lines. (C) Line graph compares cross-data classification performance of TAMC models trained on multiple (GM12878 and HepG2) ATAC-seq data with 150M, 100M and 50M sequencing depth. (D) Line graph compares cross-data classification performance of TAMC (multiple, 150M) with TOBIAS and HINT-ATAC. The performance of models within each line graph were ranked from 1 to 3 for each TF. The higher AUROC is, the lower rank number is given. The points in the line graphs show the average AUROC ranks for 47 TFs for each method/model and the error bars represent standard error or mean (SEM). Difference between the performance of TAMC (multiple, 150M) and the other methods/models were examined using Friedman-Nemenyi test and significant differences are labeled (* p < 0.05; ** p < 0.01; *** p < 0.001). Complete statistic test results for B, C and D are provided in S3 Table. The cell type and sequencing depth of ATAC-seq data used for train TAMC models are indicated within the parenthesis. HINT-ATAC models pre-trained on GM128782 ATAC-seq data were used for all testing, while TOBIAS does not require model training before testing. M denotes million high-quality non-mitochondrial aligned reads.

