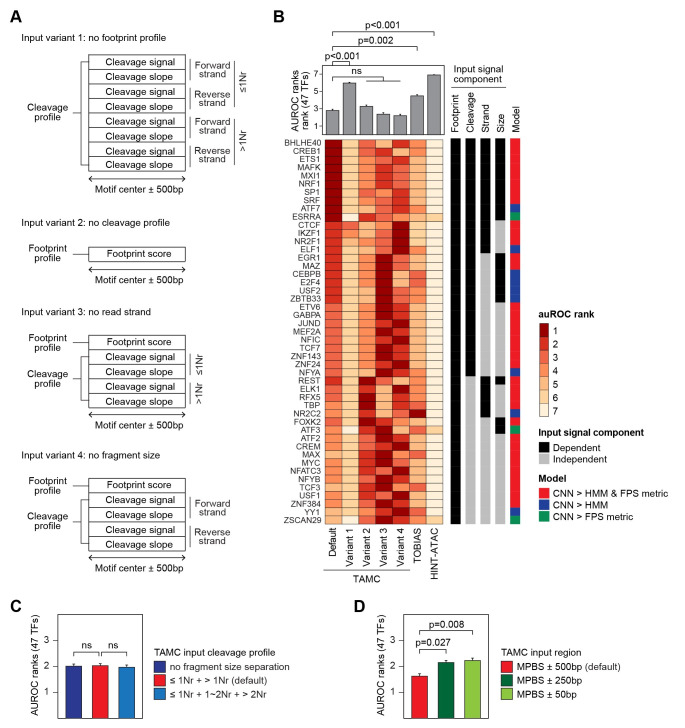
Fig 5. TAMC captures both footprint and non-footprint features of TFBSs by deep learning.
(A) Schematic of variant TAMC input structures that lack footprint score (Variant 1), cleavage profile (Variant 2), ATAC-seq read strand (Variant 3) and ATAC-seq read fragment size (Variant 4) information, respectively. (B) Bar plot and heat map compares intra-data classification performance of TAMC using default and variant input structures together with TOBIAS and HINT-ATAC in GM12878 cells. TFs that require footprint score, cleavage profile, strand or size information within the input signal or the 1D-CNN model for better prediction are indicated in the side bar. (C) Bar plot compares intra-data classification performance of TAMC models using inputs with different fragment size separations for the cleavage profile in GM12878 cells. (D) Bar plot compares intra-data prediction performance of TAMC models using inputs generated from different region length surrounding MPBSs in GM12878 cells. The models are ranked by their performance within each plot. The higher AUROC is, the lower rank number is given. Average AUROC ranks for 47 TFs for each model were shown in the bar plots (B, C, and D) and the error bars represent SEM. Difference between the performance of default TAMC and the other models were examined using Friedman-Nemenyi test and p-values for selected comparisons are indicated. Complete statistic test results are provided in S3 Table.

