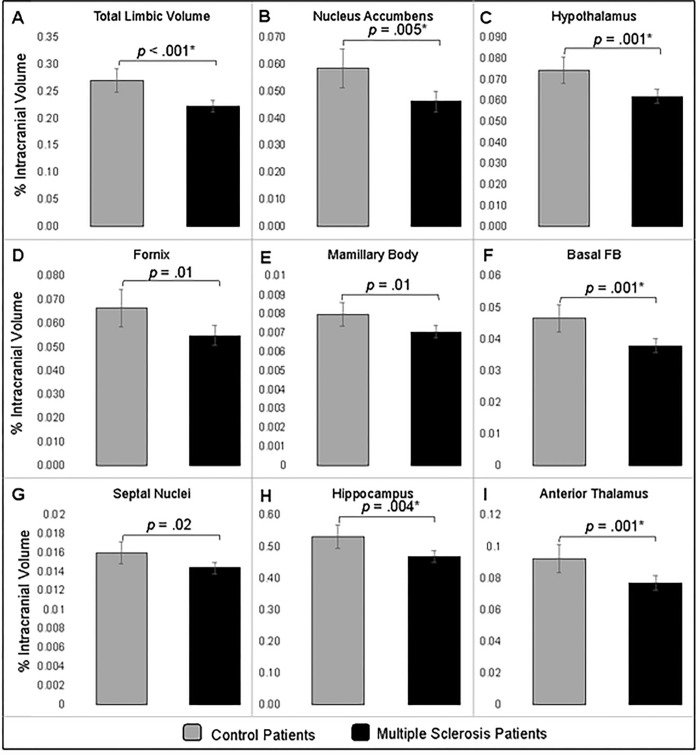
Fig 1. Comparison of limbic region volume between MS and control patients.
The mean (95% CI) percentage of total intracranial volume occupied by limbic nuclei that were significantly different between the groups. ANCOVA analyses adjusted for patient race, age, sex, and BMI. The p-value for each comparison are presented and an asterisk (*) indicates the comparison remained statistically significant following application of the Bonferroni correction.

