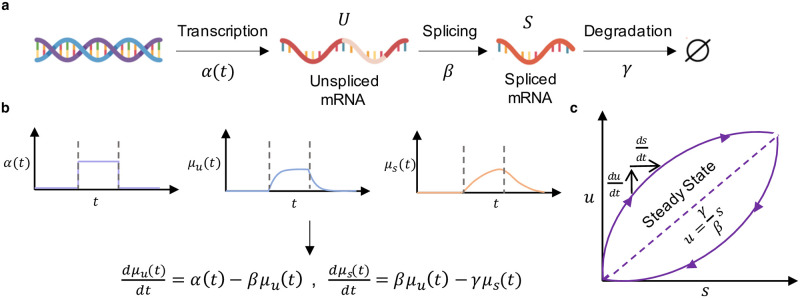
Fig 3.
a. The continuous model of transcription, splicing, and degradation used for RNA velocity analysis. b. Plots of α(t), μu(t), and μs(t) over time t and the corresponding governing equations for the system. Dashed lines indicate time of switching event. c. Outline of the common phase portrait representation, with both steady state and dynamical models denoted. Adapted from [1]. The DNA and RNA illustrations are derived from the DNA Twemoji by Twitter, Inc., used under CC-BY 4.0.

