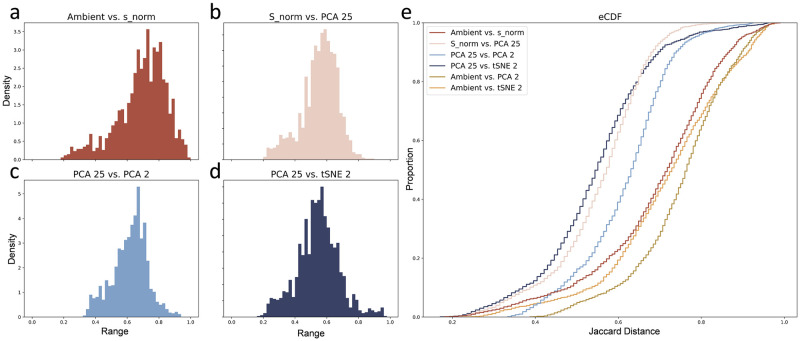
Fig 6. Normalization followed by two rounds of dimensionality reduction introduce distortions in the local neighborhoods.
a.– d. Histograms of Jaccard distances between intermediate embeddings. e. Empirical cumulative distribution functions of Jaccard distances between intermediate embeddings, as well as the overall distortion (Ambient vs. PCA 2 and Ambient vs. tSNE 2). The palette used is derived from dutchmasters by EdwinTh.

