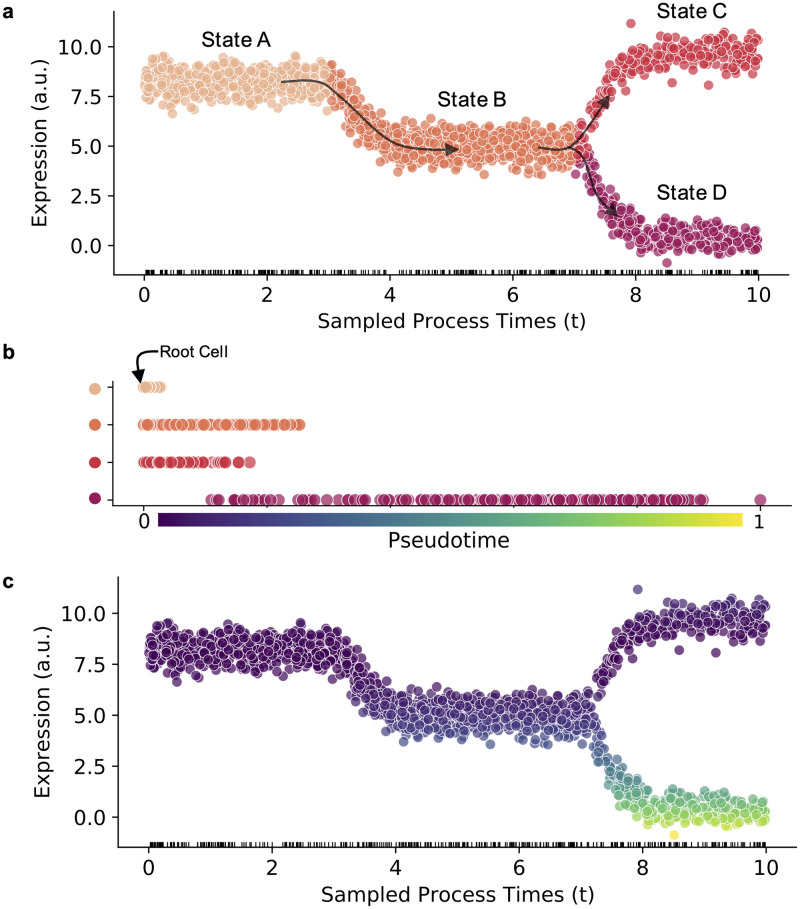
Fig 8. Markov Chain process time versus expression pseudotime.
a. Simulated gene expression for 2000 cells over 4 states (states A, B, C, and D) with a bifurcation at C/D showing spliced counts of a single gene at the sampled process times. The abbreviation a.u. denotes arbitrary units. b. Ordering of all cells by expression pseudotime coordinate, calculated as the Euclidean distance between each cell and the root cell (cell at time t = 0) and scaled to between 0 and 1. c. The sampled cells colored by the calculated pseudotime value.

